
Isolations
What is feature isolation?
Feature isolation does what it says on the tin - it isolates which features in the input the model is using to make its prediction.
We can apply feature isolation in two ways:
On a prototype that we've generated, to isolate which features are shared between entangled classes, and so help explain how those classes are entangled; and
On some input data, to explain individual predictions that your model makes, by isolating the features in the input that correspond to the predicted class (similar to saliency mapping).
So, you can use it to both understand properties of your model as a whole, and to better understand the individual predictions it makes.
Continuing with our example from the previous Entanglements section, I'll start with the second application on input data. Until this point we have been focused on data-independent evaluation, but now I want to test my model based on the entanglement I found between the ice cream and yogurt classes. I did this by providing the leap library a picture of frozen yogurt I found on the internet (instructions can be found in the tutorial section heading Sample Feature Isolation). These are the results in the dashboard:
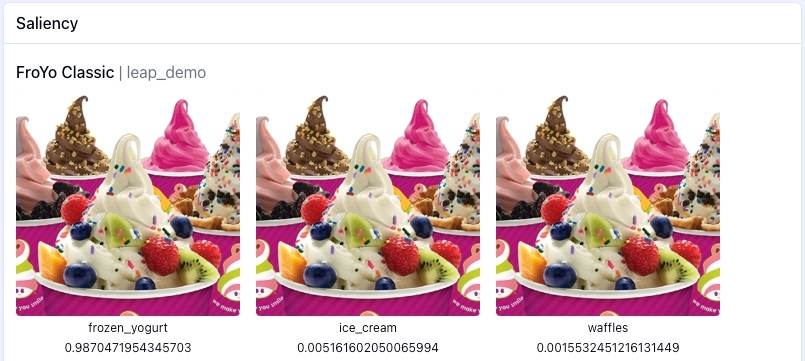
The first class on the left is what the model has classified the image as. My model did well! It has correctly classified the picture of frozen yogurt. The proceeding images are the next two classifications most likely to be made by the model. Ice cream makes sense as it is the most entangled class with frozen yogurt. But waffles? That seems odd.
When we look at the isolations of what features the model is using to make these predictions, the confusion becomes clear:
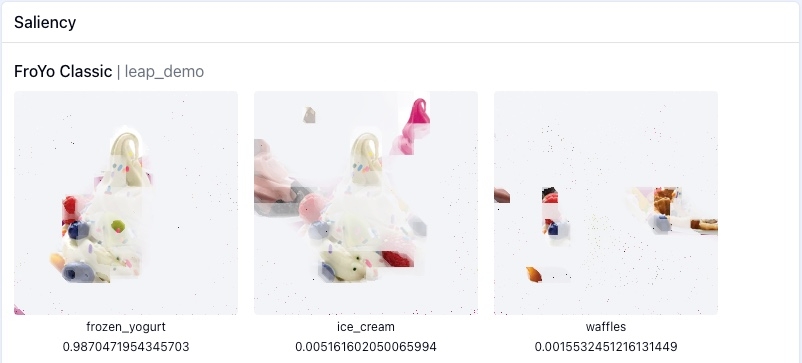
The model is using the berries from the frozen yogurt sample for the waffle prediction. Remember the waffle prototype from our prototypes example? It had berries in it. This confirms that the model may misclassify samples with berries in them as waffles.
Now let's see how isolation works for prototypes. Here is isolation performed on the class pancakes:
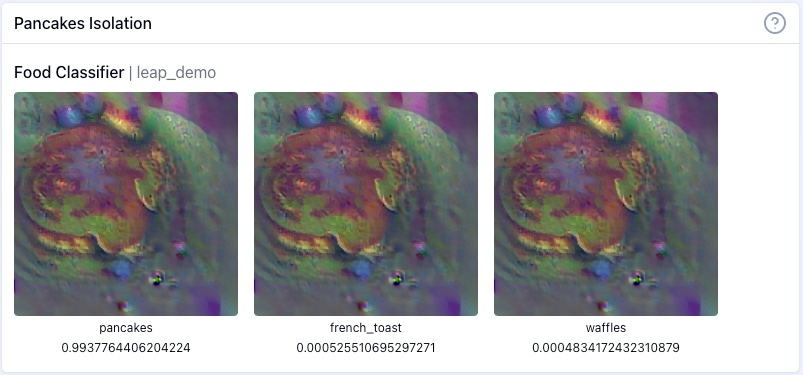
The pattern is the same, with the model classification first followed by the next most likely classifications. Now we can isolate the features that lead to this order of classifications:
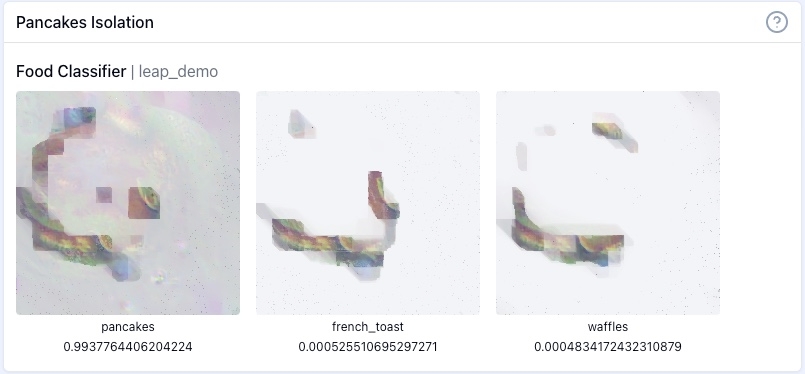
On all of the isolations the model finds the edges of the pancakes the most important for classification. They also all include at least one of the blueberries. Armed with this information we can refine our testing and targeted fine-tuning processes.